Bill Williams Market Facilitation Index (BW MFI) Indicator

The Bill Williams MFI Indicator
The Market Facilitation Index (MFI), developed by the legendary trader Bill Williams, is a unique indicator that measures the efficiency of price movement. It assesses the market’s willingness to move the price by relating the price range of a bar to the volume traded during that period. In essence, it tells us how much price movement we get for each unit of volume.
The indicator’s primary role is not to predict direction but to gauge the strength or weakness of the current price action. By interpreting the relationship between the MFI and volume, a trader can determine whether a trend is robust, weakening, or a potential trap.
Mathematical Formula for the MFI
The calculation for a single bar’s Market Facilitation Index is deceptively simple. It is the ratio of the bar’s range (High minus Low) to its volume.
This value represents the change in price per unit of volume, which Bill Williams referred to as a “tick”. However, the absolute value of the MFI is not the focus. The analysis comes from comparing the current bar’s MFI and volume with the previous bar’s MFI and volume. This dynamic relationship gives rise to four distinct market conditions.
How to Calculate the MFI
Let’s walk through a single calculation step. Assume we are looking at a 15-minute candle for NIFTY with the following data:
- High: 18,650.75
- Low: 18,625.25
- Volume: 2,500,000 contracts
First, we calculate the range of the bar:
Next, we plug this range and the volume into the MFI formula:
This small number is the MFI value for this bar. To interpret it, we would then compare it to the MFI of the prior bar and see if volume increased or decreased from the prior bar.
How to Read the MFI: The Four Market Conditions
The core of the BW MFI is its colour-coded histogram, which visually represents four distinct states of market efficiency. These states are determined by whether the MFI and Volume are increasing or decreasing compared to the previous bar.
| Bar Colour | Condition | Bill Williams’ Name | Interpretation |
|---|---|---|---|
| Green | MFI Up, Volume Up | Green | The market is efficient. New money is entering and supports the current direction. The trend is strong and accelerating. |
| Brown | MFI Down, Volume Down | Fade | The market is losing interest. The trend is pausing, and traders are hesitant. This is a period of consolidation. |
| Blue | MFI Up, Volume Down | Fake | The market is inefficient. The price is moving on low volume, indicating a lack of genuine participation. It’s a “fake” move, often driven by speculators. |
| Pink | MFI Down, Volume Up | Squat | A significant battle between buyers and sellers. High volume is churning, but the price range is narrow (“squatting”). A major breakout is often imminent. |
1. Green Bar (MFI Up, Volume Up)
A green bar signals a healthy and robust trend. Both the price range and volume are increasing, which means new capital is flowing into the market, pushing the price in the direction of the trend. This is the most efficient market state, where traders can have the most confidence in the current move, whether it’s up or down.
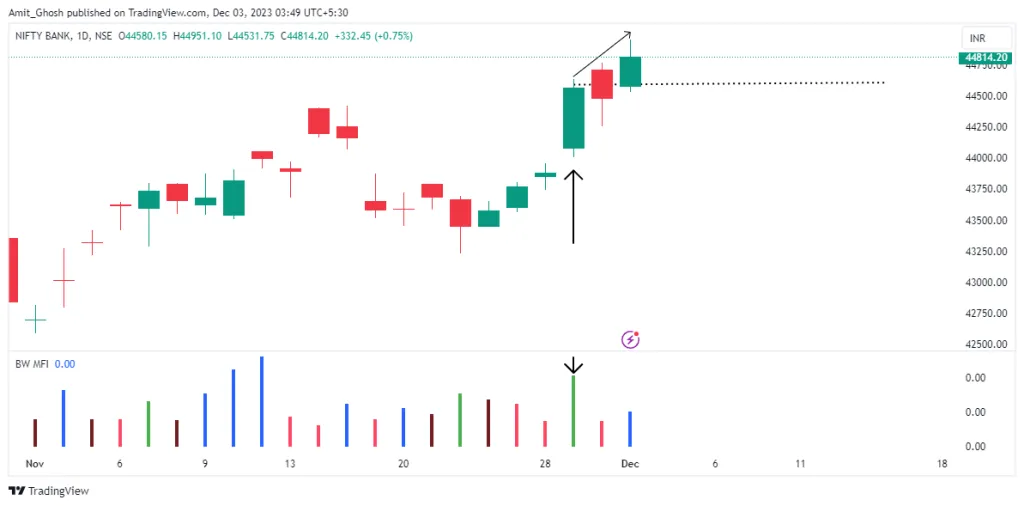
In the BankNIFTY chart above, a green bar appears during a strong uptrend, confirming the strength of the move. The index continued to rally for the next two sessions, validating the signal.
2. Brown Bar (MFI Down, Volume Down)
A brown bar, or “Fade,” indicates waning interest from traders. Both the price range and volume are decreasing, suggesting the market is taking a pause. The trend is not necessarily over, but the momentum has faded. This often happens at the end of a trend as profits are taken or before a period of sideways consolidation. A series of fade bars can signal an impending reversal.
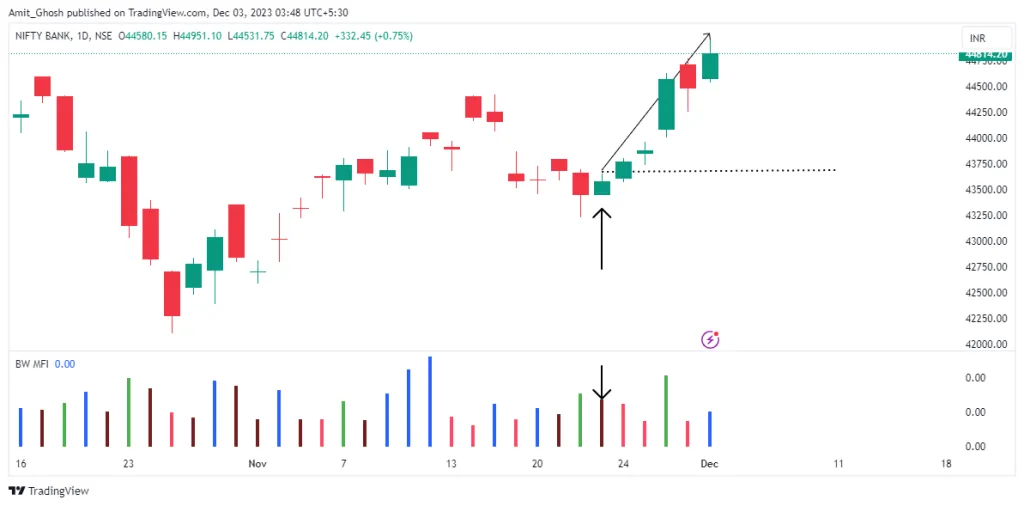
Here, BankNIFTY was in a downtrend. A green candle formed with a brown MFI bar, indicating the bearish momentum was fading. This marked the bottom of the move, and a trend reversal followed.
3. Blue Bar (MFI Up, Volume Down)
A blue bar is a “Fake” signal. The price range is expanding, but it is not supported by volume. This suggests the move is artificial, likely driven by amateur traders or speculative pops in an illiquid market, rather than institutional activity. Professionals see this as a warning sign and will not chase the price move. It’s a classic trap for unsuspecting traders.
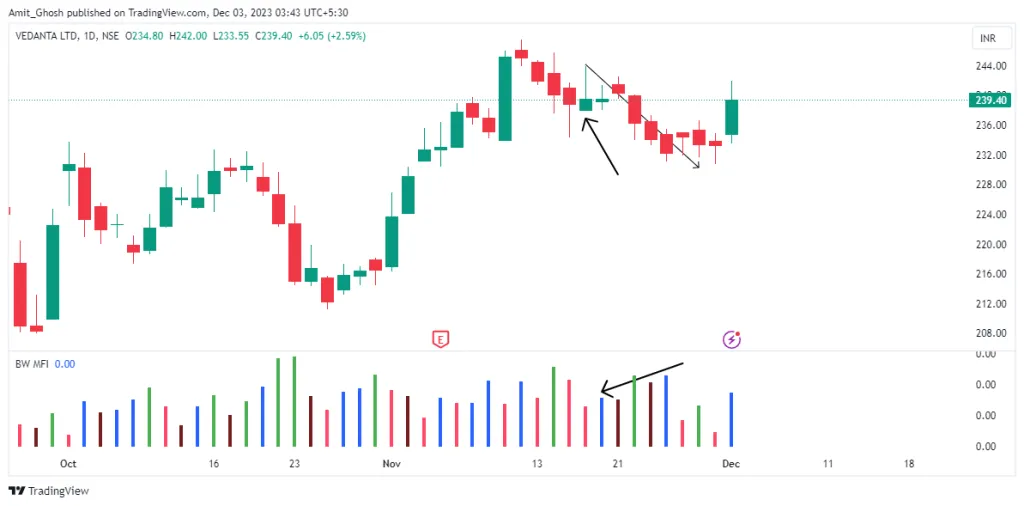
In this example, after a series of red candles, a green candle appears with a blue MFI bar. This warns that the apparent upward move lacks conviction. True to the signal, it was merely a minor retracement, forming a lower high before the downtrend resumed.
4. Pink Bar (MFI Down, Volume Up)
A pink bar, or “Squat,” is one of the most powerful signals from the MFI. It represents a fierce battle between bulls and bears. Volume is high, indicating significant market interest, but the price range is compressed or “squatting.” This shows that a large number of buyers and sellers are fighting for control, but neither side has won yet. A Squat bar often precedes a volatile breakout. The direction of the breakout is determined by whichever side ultimately wins the battle.
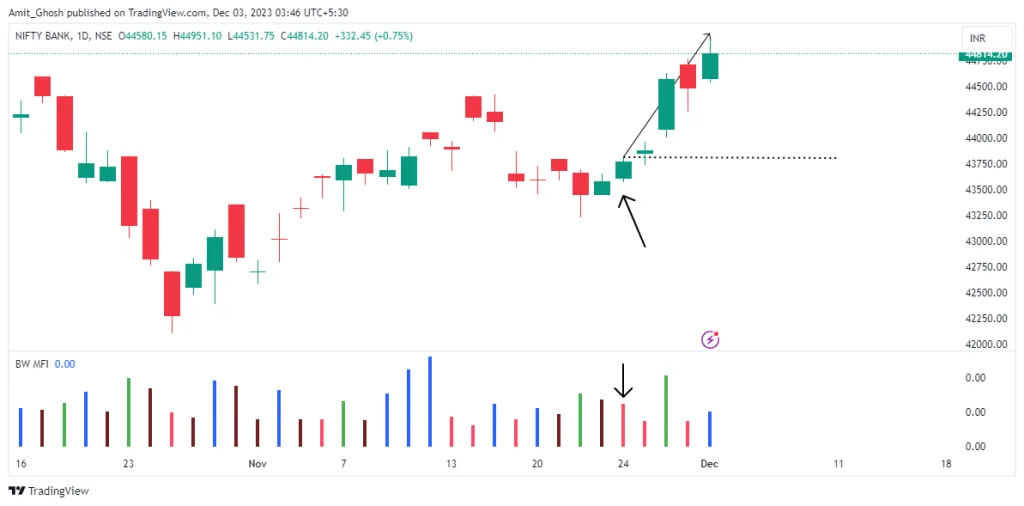
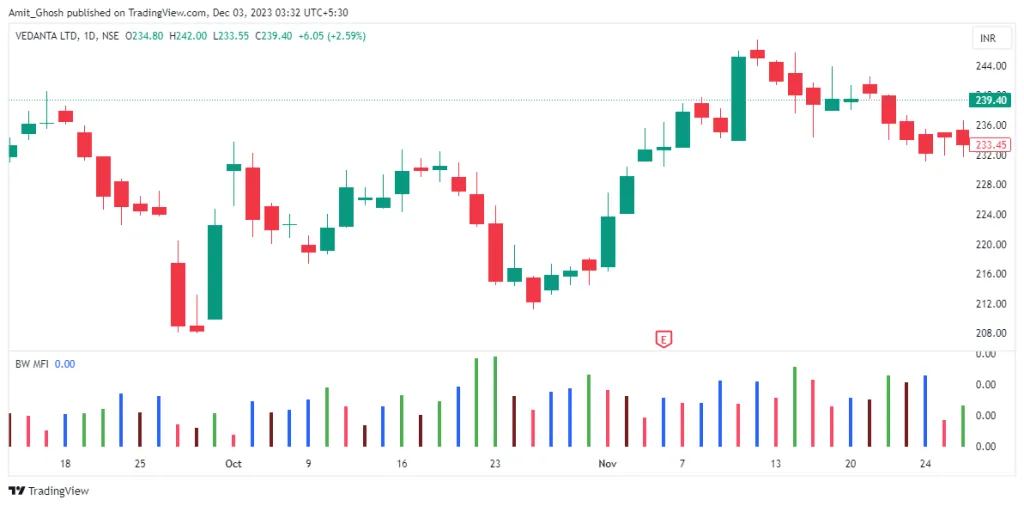
Here, a pink bar signals a high-volume consolidation. The subsequent candle broke the high of the pink bar candle, indicating the bulls had won. This served as an excellent entry trigger for the strong upward move that followed.
Trading Uses of the BW MFI
- Trend Confirmation: A series of green bars during a rally or sell-off confirms the trend’s health and encourages staying in the trade.
- Exhaustion Warning: A brown (Fade) bar appearing at the top of an uptrend or bottom of a downtrend signals that the move is running out of steam and it may be time to take profits.
- Trap Avoidance: A blue (Fake) bar warns traders not to enter a breakout that lacks volume support, thereby avoiding a potential bull or bear trap.
– Breakout Trading: A pink (Squat) bar identifies a point of high tension. Traders can place entry orders above the high and below the low of the Squat bar candle to catch the subsequent breakout.
Best Timeframes for Indian Markets
For actively traded NSE stocks and indices like NIFTY and BANKNIFTY, the BW MFI tends to provide the cleanest signals on the 15-minute and 1-hour charts. These timeframes are effective at filtering out the noise of intraday scalping while remaining responsive enough for swing trading decisions. On daily charts, the signals are much slower but can be used to gauge the conviction behind major weekly moves.
TradingView Pine Script for BW MFI
The standard TradingView library does not include a colour-coded BW MFI by default. The following Pine Script code replicates the four-colour histogram based on Bill Williams’ original methodology.
@version=5
// Author: Dexter
indicator("Bill Williams Market Facilitation Index", shorttitle="BW MFI", overlay=false)

// Calculate the Market Facilitation Index
mfi = (high - low) / volume

// Custom colors for clarity
custom_brown = color.new(#721f1f, 0) // A dark brown for the Fade bar
custom_pink = color.new(#fd4967, 0)  // A distinct pink for the Squat bar

// Define color conditions based on Bill Williams' methodology
mfi_up = ta.change(mfi) > 0
mfi_down = ta.change(mfi) < 0
vol_up = ta.change(volume) > 0
vol_down = ta.change(volume) < 0

green_f = mfi_up and vol_up
fade_f = mfi_down and vol_down
fake_f = mfi_up and vol_down
squat_f = mfi_down and vol_up

// Assign colors based on the conditions
b_color = green_f ? color.green : fade_f ? custom_brown : fake_f ? color.blue : squat_f ? custom_pink : na

// Plot the MFI as a histogram
plot(mfi, color=b_color, style=plot.style_histogram, linewidth=4)Conclusion
The Bill Williams Market Facilitation Index is a powerful tool for diagnosing the character of the market. It moves beyond simple price action to reveal the underlying conviction, or lack thereof, behind a move. By learning to interpret the four distinct conditions—Green, Fade, Fake, and Squat—a trader can significantly improve their ability to confirm trends, avoid traps, and position themselves for high-probability breakouts.
In summary, you have learned:
- The MFI is a volatility and market efficiency indicator, calculated as (High - Low) / Volume.
- It measures the strength and conviction of price movements, not their direction.
- It uses a four-colour system (Green, Brown, Blue, Pink) to classify the relationship between MFI and Volume changes, helping traders understand the market's current state.